PROGRAM - Include data and univariate and bivariate graphs
LIBNAME mydata "/courses/d1406ae5ba27fe300 " access=readonly;
DATA new;set mydata.addhealth_pds;
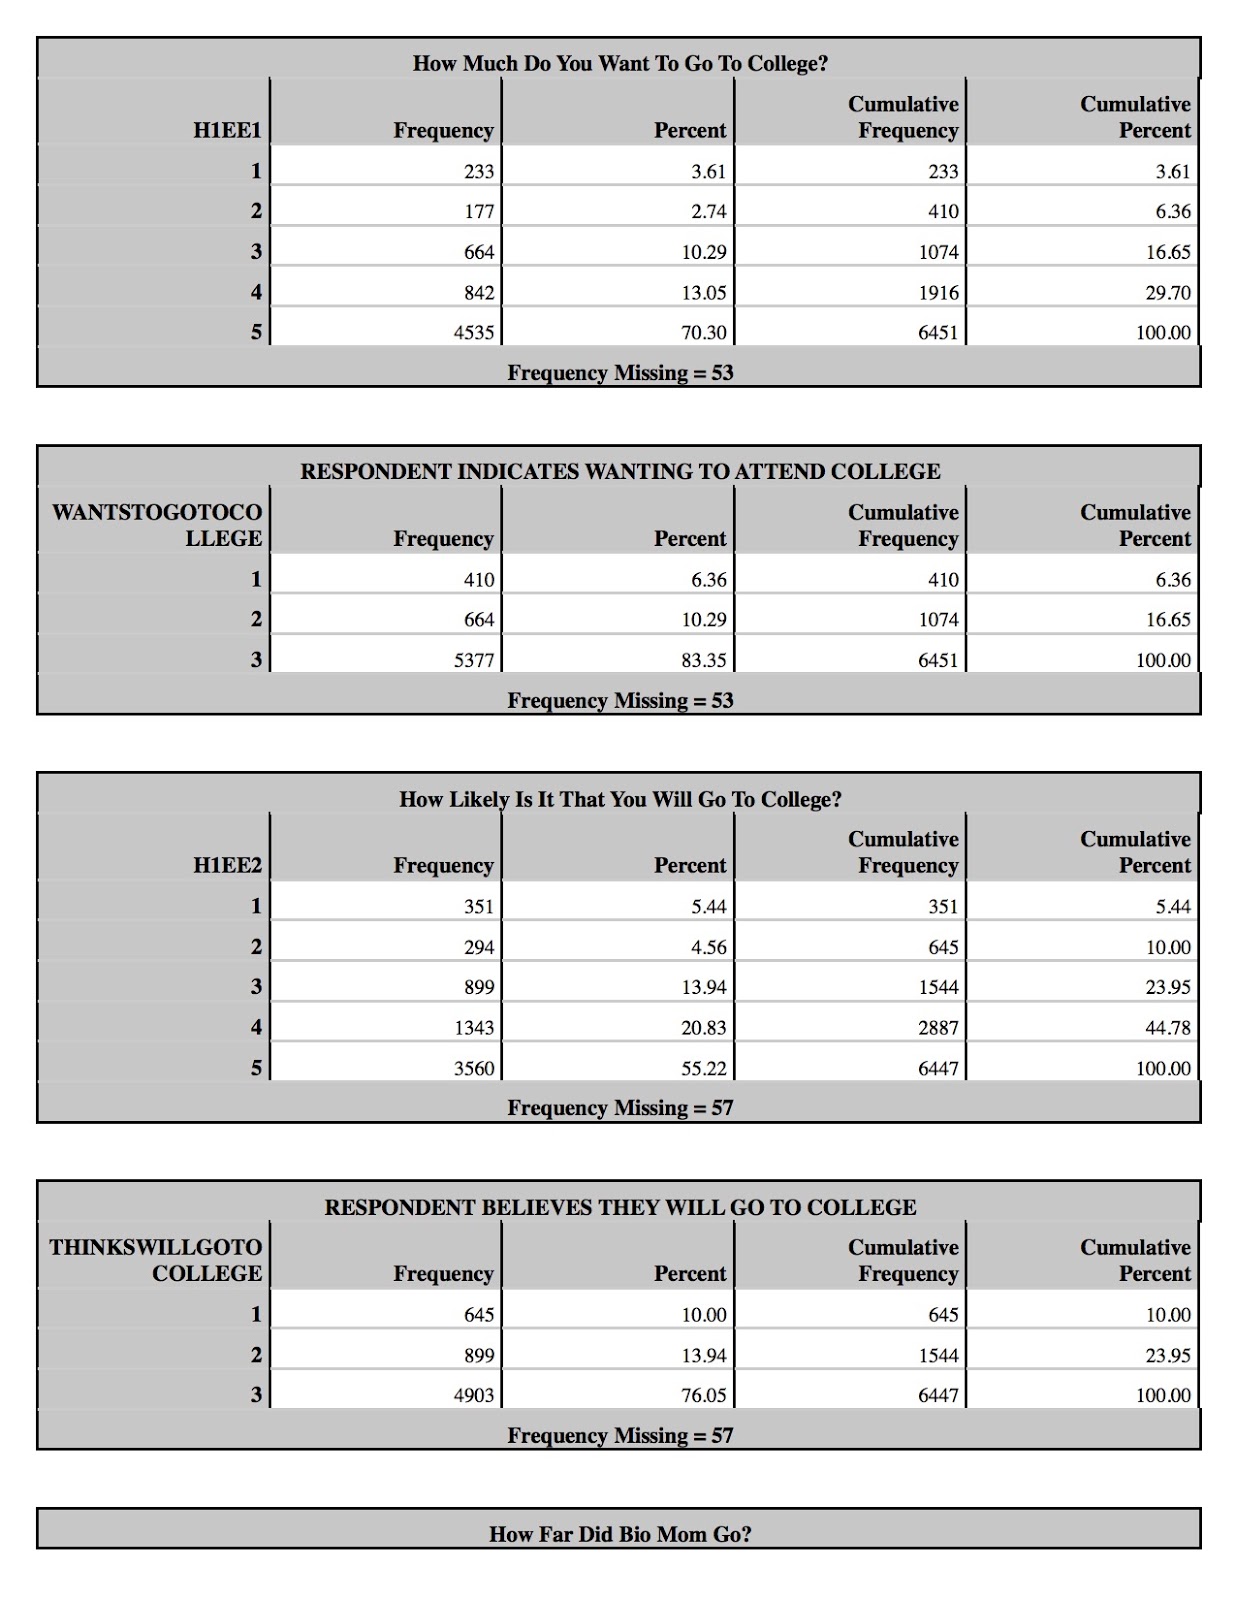
label h1ee1="How Much Do You Want To Go To College?"
h1ee2="How Likely Is It That You Will Go To College?"
h1wp11="How Disappointed Would Mom Be If You Did not Graduate College?"
h1wp15="How Disappointed Would Dad Be If You Did not Graduate College?";
IF h1ee1=8 THEN h1ee1=.;
IF h1ee1=6 THEN h1ee1=.;
IF h1ee2=8 THEN h1ee2=.;
IF h1ee2=6 THEN h1ee2=.;
IF h1wp11=6 then h1wp11=.; /* 6=refused*/
IF h1wp11=7 then h1wp11=.; /* 6=legit skip - no mom*/
IF h1wp11=8 then h1wp11=.; /* 6=don't know IT IS ODD THAT THIS QUESTION DOES NOT HAVE RESPONSES FOR 9 AS ALL OTHER SIMILAR ONES DO??*/
IF h1wp15=6 then h1wp15=.; /* 6=refused*/
IF h1wp15=7 then h1wp15=.; /* 6=legit skip - no mom*/
IF h1wp15=8 then h1wp15=.; /* 6=don't know*/
IF h1wp15=9 then h1wp15=.; /* 6=not applicable*/
proc sort; by AID;
proc freq; tables h1ee1 h1ee2 h1wp11 h1wp15;
PROC GCHART; VBAR h1ee1/DISCRETE TYPE=PCT WIDTH=20; /* PCT= PERCENTAGES WIDTH 30 = 30 UNITS WIDE*/
PROC GCHART; VBAR h1ee2/DISCRETE TYPE=PCT WIDTH=20; /* PCT= PERCENTAGES WIDTH 30 = 30 UNITS WIDE*/
PROC GCHART; VBAR H1WP11/DISCRETE TYPE=PCT WIDTH=20;
PROC GCHART; VBAR h1WP15/DISCRETE TYPE=PCT WIDTH=20;
PROC UNIVARIATE; VAR H1EE1 H1EE2 H1WP11 H1WP15;
PROC GCHART; VBAR H1WP11/DISCRETE TYPE=MEAN SUMVAR=H1EE1;
PROC GCHART; VBAR H1WP15/DISCRETE TYPE=MEAN SUMVAR=H1EE1;
run;
GRAPHS

This is the primary question that I am focusing my hypothesis on - the desire or longing to attend college. it is my belief that there is a correlation between the college going habits of parents and their children. I believe that the perception that their parents want them to go to college, or that they will be disappointed if they do not gradate college, will correlate to the desire to go to college by respondent adolescents. The graph has a left skew and is unimodal.

In this univariate graph we see the respondents ranking on how they feel that their mother would feel if they did not graduate from college. 1 being not disappointed, and 5 being very or highly disappointed. There is another almost exact graph for how their dad would feel. i did not include it as to not bore you with the details. More respondents fee that their parents would be disappointed if they did not graduate college. The graph has a left skew and is unimodal. I need to look at why their is a deviation from the standard flow for responses of "2". why the drop?

This is the bivariate graph comparing the respondents desire to go to college, and their belief that their mother wants them to go to college and graduate. As you can see their is a positive relationship between these two variables, or a high desire to go to college as the perceived desire by the mother for them to graduate rises.

Similar to the previous bivariate graph this graph for fathers also show a positive relationship between the respondents desire to attend college and the level at which they perceive their father wants them to graduate from college.